Corruption in Kosovo: A Comparative Analysis
Previously in Part I of this series, we looked at corruption in Kosovo from the perspective of Kosovo civil servants, as documented in a United Nations Development Programme (UNDP) report entitled Gender Equality Related Corruption Risks and Vulnerabilities in Civil Service in Kosovo[1].
In Part II we are now going to look at global corruption perception statistics compiled by Transparency International to consider how Kosovo compares internationally.
An International Comparison of Corruption
Transparency International is an organization that works to reduce corruption[2] through increasing the transparency of Governments around the world. Arguably Transparency International’s most well known contribution is the Corruption Perceptions Index (CPI), an index measuring “the perceived levels of public sector corruption worldwide”. In 2014[3] the CPI was calculated by aggregating 12 indices and data sources collected from 11 different independent institutions specializing in governance and business climate analysis over the past 24 months. The 2014 CPI covered 175 countries, including Kosovo.
In addition to the CPI, Transparency International does its own survey and data collection in the form of the Global Corruption Barometer (GCB survey). The GCB survey focuses on the public’s opinion of corruption within their own country, and in 2013 (the latest edition of the GCB available at the time of writing) collected the opinions of over 114,000 people across 107 countries – including Kosovo.
So what did these two reports show?
Results
In the CPI, Kosovo performs poorly, placing 110th out of 175 countries with a score of 33 out of 100 (unchanged from 2013). To give some perspective, Kosovo finished equal 110th with 4 other countries – Albania, Ecuador, Ethiopia, and Malawi. This placed it behind Argentina (107th), Mexico (103rd), China (100th), India (85th) and Greece (69th), countries that are often associated with high levels of corruption. Finally, this was the lowest ranking for any country in the Balkans region (tied with Albania).

The GCB survey, however, shows that the people in Kosovo have a different perception of corruption in several areas to that reported in the CPI. Based on the responses to question 6[4] (see Chart 1) and question 7[5] (see Chart 2) of the GCB survey, people in Kosovo are somewhat more optimistic about the levels of corruption in their country than the low rating on the CPI might indicate. Kosovo scores well in several areas:
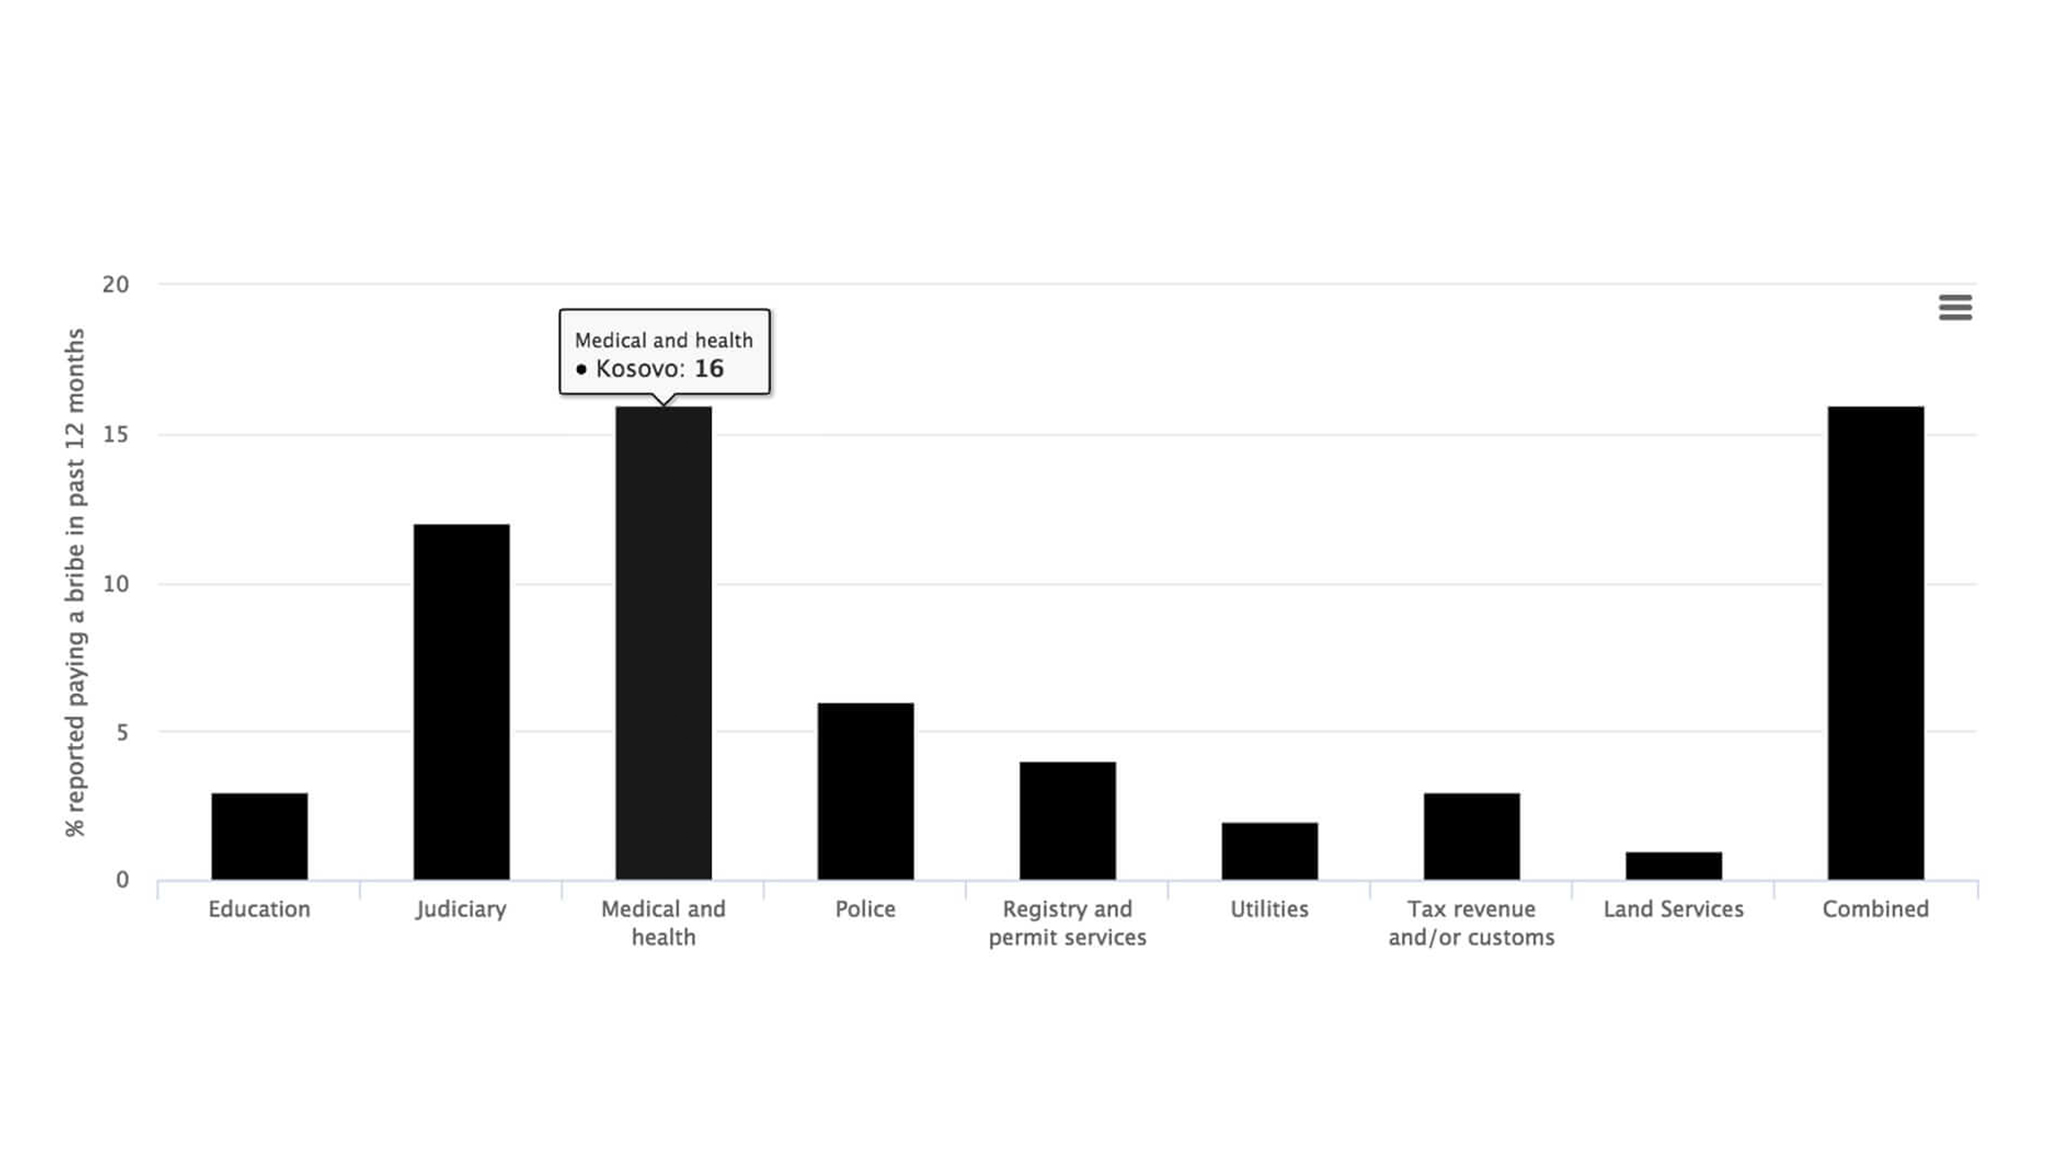
- Only 16% of people reported having paid a bribe in the last 12 months. This placed Kosovo 35th out of the 95 countries that provided a response to question 7.
- 46% of Kosovars generally believe their public institutions to be corrupt or extremely corrupt. This sounds high but actually puts Kosovo ahead of the US (47%) and only slightly behind Germany (40%). The results for certain institutions were even better:
- The Military is believed to be corrupt or extremely corrupt by only 8% of those interviewed – only four countries had a lower percentage than Kosovo on this part of question 6.
- NGOs and Religious bodies were also seen as uncorrupt by large majorities.
- 44% of people believed public officials and civil servants were corrupt, placing Kosovo ahead of Germany, France and the US, among others.
Chart 2 – GCB Survey Q7 – Reports of Bribes Paid by Institution for 6 Countries

But not all the results were positive. Questions 1[6], 4[7] and 5[8] in the GCB survey in particular highlight a more pessimistic outlook:
- In response to question 1, 66% of Kosovars stated that they believed corruption had increased over the past 2 years, while only 8% believed it had decreased.
- In response to question 4, 74% of Kosovars stated they believed their Government is run by large entities largely or entirely for their own benefit.
- In response to question 5, only 11% of Kosovars surveyed believed the actions of their Government in the fight against corruption are effective.
What does all this mean? Why does Kosovo perform so poorly on the CPI, and on some GCB survey questions, but on other questions the perceived level of corruption of people in Kosovo is comparable to some developed nations?
Perceptions vs. Reality
One of the issues when looking at the results of the GCB survey is that the responses to most of these questions are subjective. What constitutes corruption or extreme corruption varies by country and culture based on what people are used to living with. What someone in South Asia or sub-Saharan Africa considers standard practice and harmless may be considered unbelievably corrupt by people in other parts of the world.
These different standards are really highlighted when we compare the percentage of people believing an institution is corrupt with the number of people reporting to have paid a bribe to that institution, using questions 6 and 7 of the GCB survey. There are four institutions that appear as options for both questions, allowing us to make a direct comparison:
- Education
- Judiciary
- Medical and Health, and
- Police
In the comparison (see Chart 3), we find numerous examples where the percentage of people that reported paying bribes was higher than the percentage of people who believed the institution was corrupt. The implication of this finding is that significant numbers of people in these countries believe that paying a bribe is not a sign of corruption.
Chart 3 – Comparison of Perceived Corruption with Bribes Paid

Kosovo and most developed nations were examples of the opposite case – they generally reported relatively high numbers of people who believed the four comparable institutions were corrupt, and relatively low percentages of people reporting bribes being paid. Bribery, of course, is not the only form of corruption, and this result could simply be an indicator that different forms of corruption are more prevalent in these countries. But it could also be an indicator that people in some countries are particularly cynical about the fidelity of their institutions.
To get a better sense of how concerned people really are about corruption, lets now take a look at some of the responses to other questions in the survey.
Is a Person’s Willingness to Take Action a Better Indicator?
One of the questions asked on the survey that could potentially reveal some further information was question 10 – “Are you willing to get involved in the fight against corruption?” Respondents were then provided with a range of activities, both active and passive, and were requested to indicate whether they would be willing to participate.
At a high level, the responses to this question appear to show an inverse correlation between the value of the CPI for a country and how willing people in that country were to do something active to fight corruption. In other words, the higher the percentage of people willing to do something active to fight corruption, the lower the CPI index for that country (i.e. a higher level of corruption).
Using a statistical model (such as regression), we can check whether this relationship is real and how strong it is. However to do this, we need to consider countries with regimes that punish dissent and crack down on protests and/or organizations that might try to combat corruption. In these countries, you would expect to have a low percentage of people willing to take action against corruption despite corruption being high.
To account for this, we need to have some sort of indicator of how worried people are about speaking out in their country. The best piece of information that we have from the GCB survey that can serve this purpose was the question asking if the respondent would be willing to report corruption.
Using these two pieces of information, we can try to test the following hypotheses:
- A high percentage of people willing to take action against corruption in a given country is indicative of a high level of corruption.
- A low percentage of people willing to take action against corruption in a given country, but a high level willing to report corruption is indicative of a low level of corruption.
- A low percentage of people willing to take action against corruption in a given country, and a low level willing to report corruption is indicative of a high level of corruption in a repressive regime
Based on these hypotheses, we also expect that there would be no (or very few) cases where there is high percentage of people willing to take action against corruption and a low level of people willing to report corruption.
Building a Model
Using our two pieces of information described above, and with the assumption that the CPI is the most accurate indicator of the true level of corruption within a country[9], we can build a model to predict CPI for each country and test our hypotheses. The formula for this model will be as follows:
Where:
Yi = the actual value of CPI for country i
β0 = a constant
Xi1 = the percentage of people willing to do something active to fight corruption[10] in country i
β1 = a constant applied to Xi1
Xi2 = the percentage of people willing report an incidence of corruption in country i
β2 = a constant applied to Xi2
εi = the residual or error
Using ordinary least squares (OLS) and the data for the 101 countries for which the CPI and the two variables (X1 and X2) described above are provided, the results of the model is as follows:

The first thing to note is that the coefficients support the three hypotheses we mentioned above:
- A strongly negative coefficient β1 indicates that the larger the percentage of people willing to do something active to fight corruption, the lower the predicted CPI.
- A strongly positive coefficient β2 indicates that the larger the percentage of people willing to report corruption, the higher the predicted CPI.
General Insights
Aside from providing support for our hypotheses, the other thing this model reveals is the countries that are not very well explained by this model. Chart 4 shows the CPI predicted by the model as compared to the actual CPI value for 2014.
Chart 4 – Predicted CPI vs. Actual CPI by Country
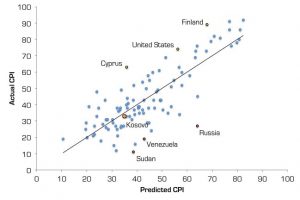
At a high level, we can split the chart into two parts:
- Points below and to the right of the line reflect countries where the actual level of the CPI was lower than the predicted level
- Points above and to the left of the line reflect countries where the actual level of the CPI was higher than the predicted level.
Starting with the first group – countries that were more corrupt than the model predicted – these cases appear to fall into two categories:
- Conflict Affected Countries – In these cases, of which Sudan is the most extreme example, there was typically a low percentage of people willing to do something active to fight corruption, and therefore the CPI was predicted to be significantly higher than it is in reality. This is likely to be due the citizenry of these countries facing more immediate problems. This pattern was seen across Sudan, Afghanistan, Iraq, Libya and South Sudan.
- Other – In these cases, of which Russia was the best example, there was generally a high percentage of people willing to report corruption (86% for Russia) and a relatively low percentage of people willing to do something active to fight corruption (47% in Russia). As a result the model predicted a relatively high CPI. The explanation for this is not as clear as above, but the evidence would seem to suggest that the people in these countries are either not aware of the high level of corruption present in their country, or that they have a significantly different opinion as to what constitutes corruption.
Contrasting with the above cases, we can also see there are countries above and to the left of the line in Chart 4. This represents countries that were less corrupt than the model predicted. In these cases the responses to the two questions were indicative of a country with a higher level of corruption than actually existed. The following were two interesting cases:
- Finland – the model was thrown off by a surprisingly low percentage of people willing to report corruption. Of the respondents from Finland, only 65% of people surveyed reported they would be willing to report corruption – a surprisingly low percentage for a country with a CPI value of 89. In fact, Finland and Japan were the only countries with a CPI above 60 that reported a percentage below 80% for this question.
- The United States – neither of the data points used for the US in the model were hugely abnormal for countries in the same CPI range. 80% of people said they would be willing to report corruption (a little lower than you would expect) and 50% said they be willing to do something active to fight corruption (a little higher than you would expect). Both of these potentially show a slightly higher level of mistrust in government than other developed nations, something that does tie in with the politics of large parts of the US.
Unlike the above examples, Kosovo appeared fairly typical for the model. Let’s now take a deeper look into the results of the model for Kosovo.
Insights for Kosovo
For Kosovo, the model was able to fairly accurately predict the CPI using the two variables described. Kosovo has both a high percentage of people willing to do something active to fight corruption (80%) and a high percentage of people willing to report corruption (84%). As a result, the model predicted a high level of corruption in Kosovo, a CPI of 35, which was just below the actual CPI value of 33.
However, aside from proving the accuracy of the model in this case, these high values reveal important information about the people of Kosovo. It reveals Kosovars do believe corruption is an issue, and that they are willing to do something about it.
Summary
Overall, there are positives and negatives for Kosovo that can be taken from the Transparency International data. On the negative side, the CPI highlights that corruption is a significant issue in Kosovo. Even in a region with consistently low CPI scores (the best performer is Slovenia with a score of 58) Kosovo is a significant underperformer. The most disappointing aspect of this underperformance is that Kosovo has had the significant advantage of 15 years of assistance from various international agencies in setting up infrastructure for good governance.
That said, there is a big positive that comes from the GCB survey data, and it is also potentially an important clue as to the best way forward for Kosovo and the international organizations involved in the region. That positive is that the people of Kosovo appear to be aware of the issues of corruption in their country, and more importantly, they are very willing to take an active role to fight it. Compared to Albania, a country with the same CPI as Kosovo, almost twice the percentage of survey respondents stated they were willing to do something active to fight corruption in Kosovo (80% vs. 44%), and significantly more people said they were willing to report corruption (84% vs. 51%).
What this suggests is that, if harnessed effectively, anti-corruption efforts in Kosovo could be very popular, and therefore powerful. But the right strategies have to be implemented and publicized to garner public support.
Somewhat unsurprisingly, we believe a key strategy has to be raising awareness of how data can be used to reduce corruption and bring about change. This can apply equally to data that is currently collected by government agencies but isn’t publically released, or new datasets that the public can assist in collecting. With the right data and right analysis, these datasets can help to improve governance in numerous ways including:
- exposing systematic corruption
- identifying gaps in anti‑corruption controls, and
- better targeting of anti-corruption efforts.
Using this open data approach also helps reduce reliance on the bravery of individual whistleblowers. Although whistleblowers are often vital in helping to identify incidents and even patterns of corruption, the fact is that, even in developed nations, they will always risk retaliation and other subtler forms of retribution (reduced career prospects, being ostracized by their peers and generally being perceived as untrustworthy).
Overall, what the results of the Transparency International data shows us is that, with better coordination and targeting of anti-corruption efforts, there is the potential to actively involve large numbers of Kosovars. If that can be achieved and funneled into meaningful strategies, the future of Kosovo could be very bright indeed.
Have any suggestions for ways data could be used to fight corruption? Disagree completely? Feel free to leave your thoughts in the comments!